Vermont College of Fine Arts
Master of Fine Arts Degree Graphic Design :: 2021
Design Research, Graphic Design History, Design Thinking, Visual Language, Social Design
Data Visualization Experimentation Projects
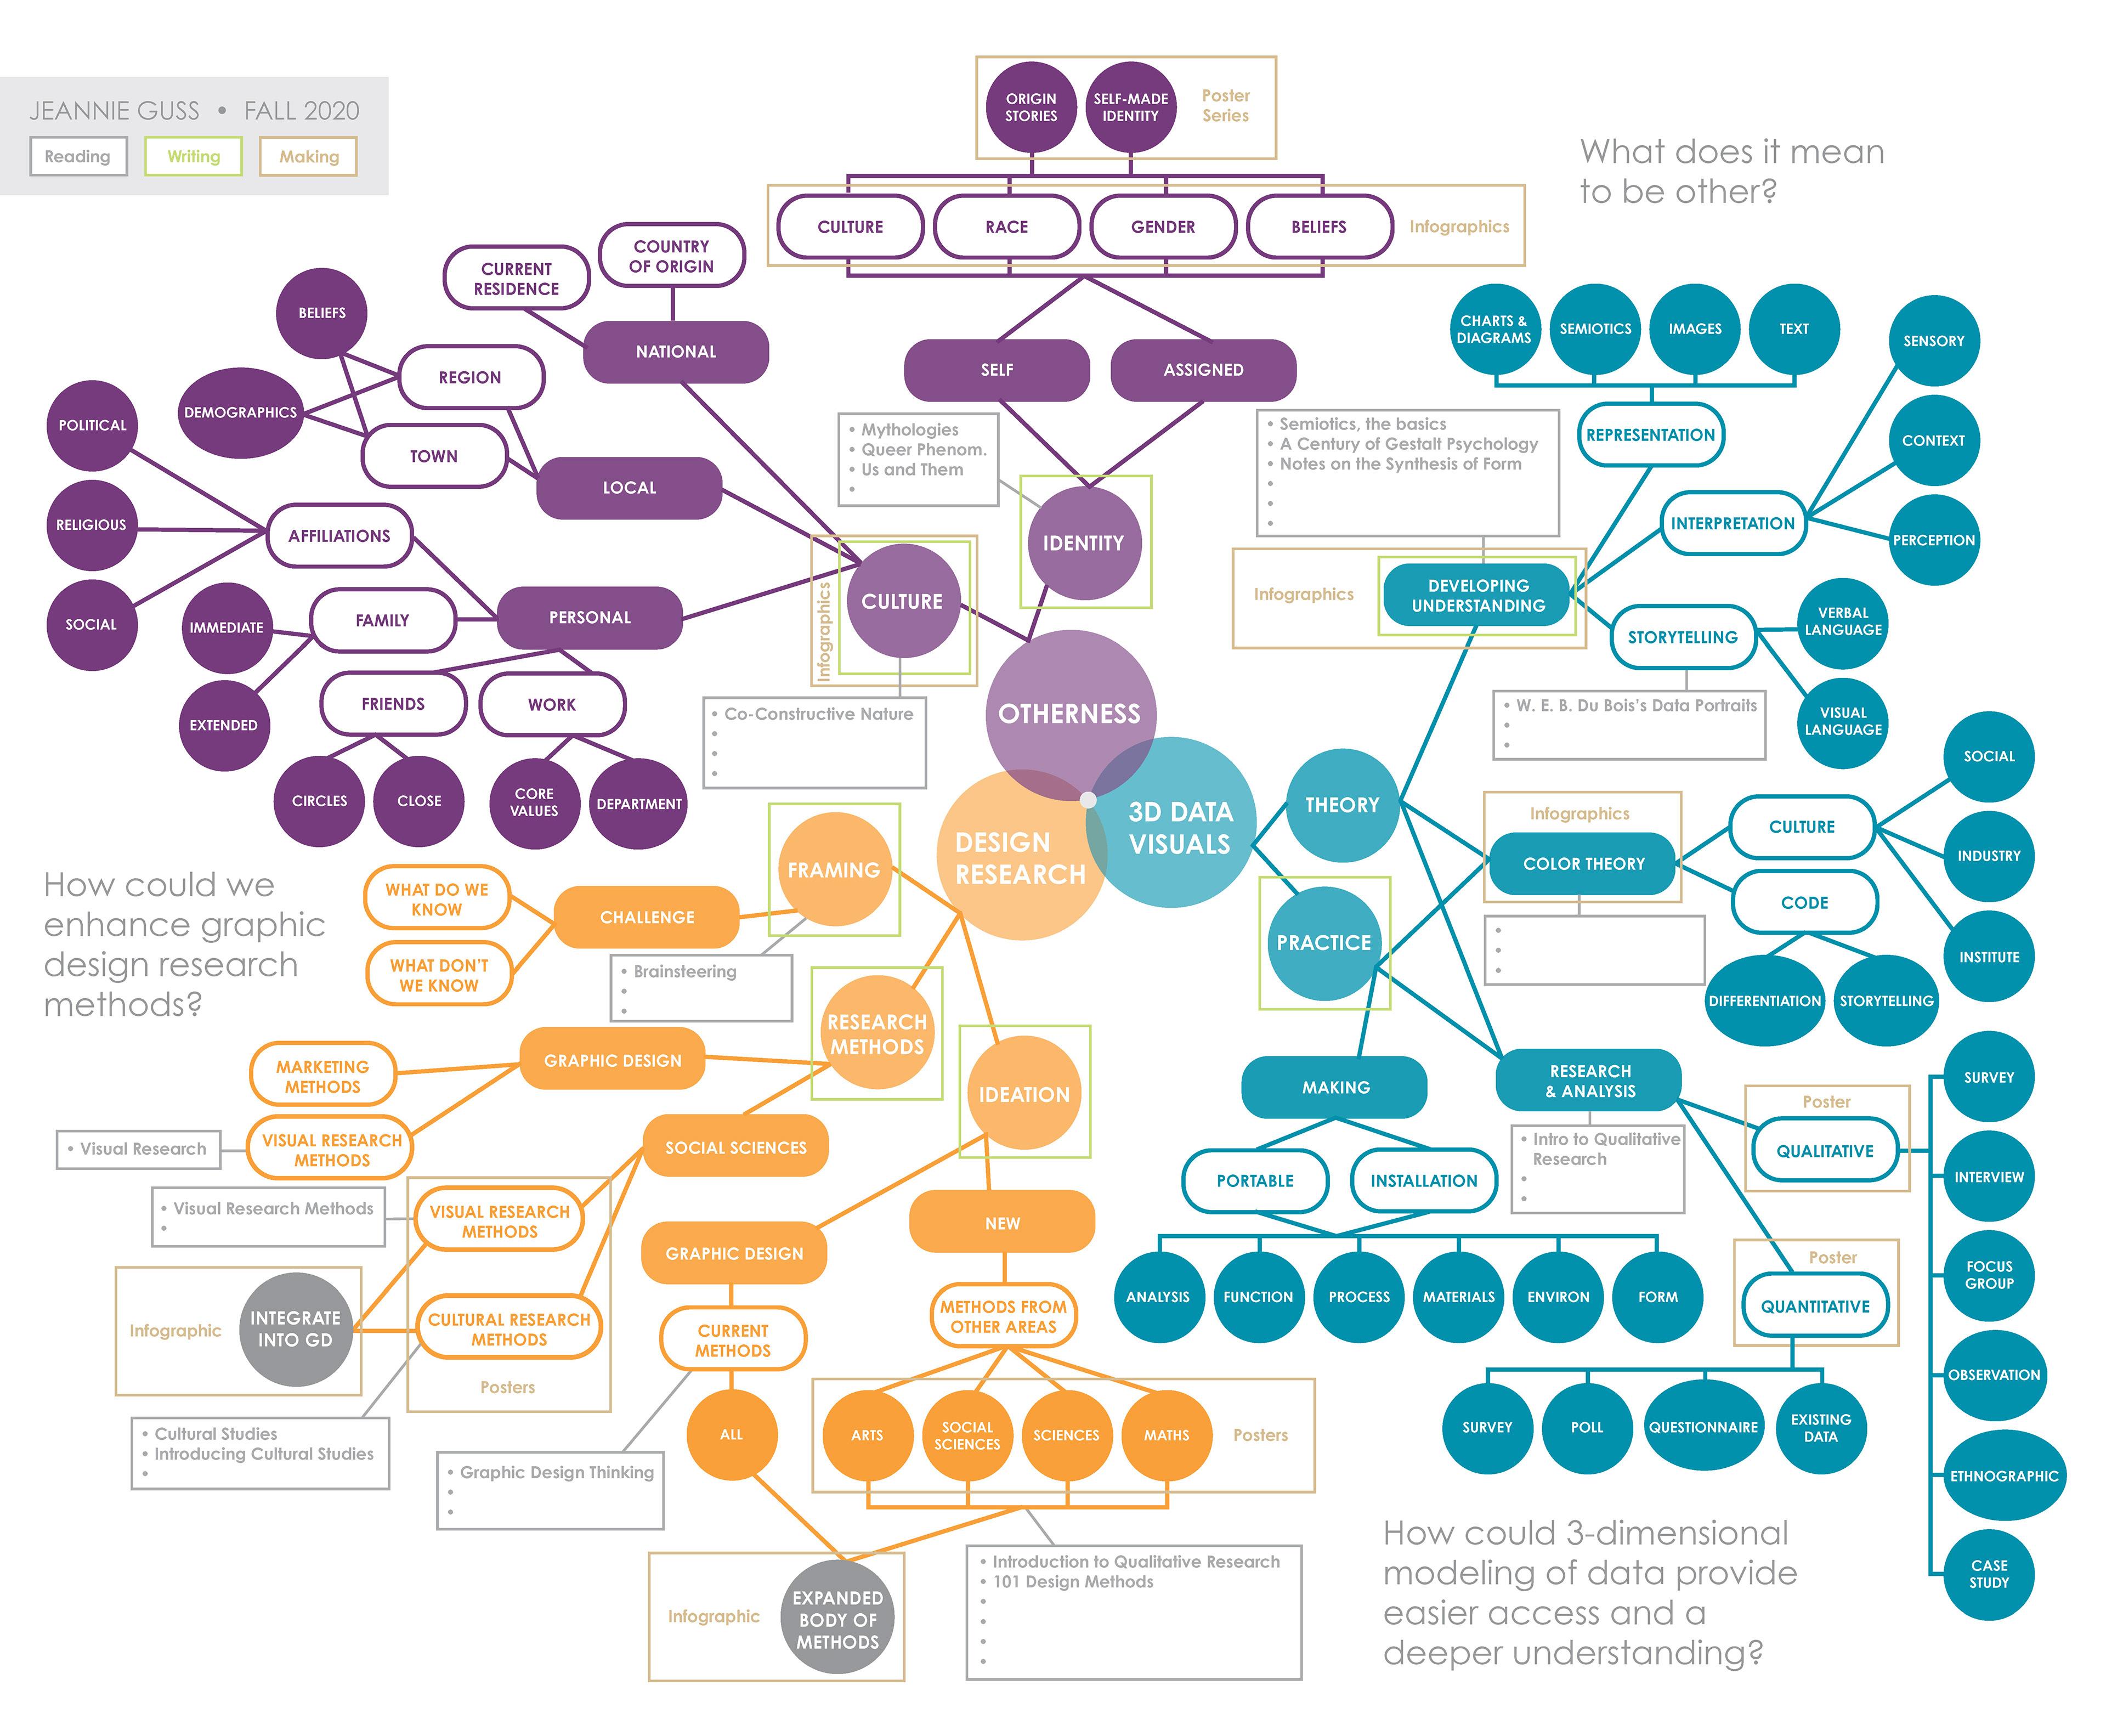
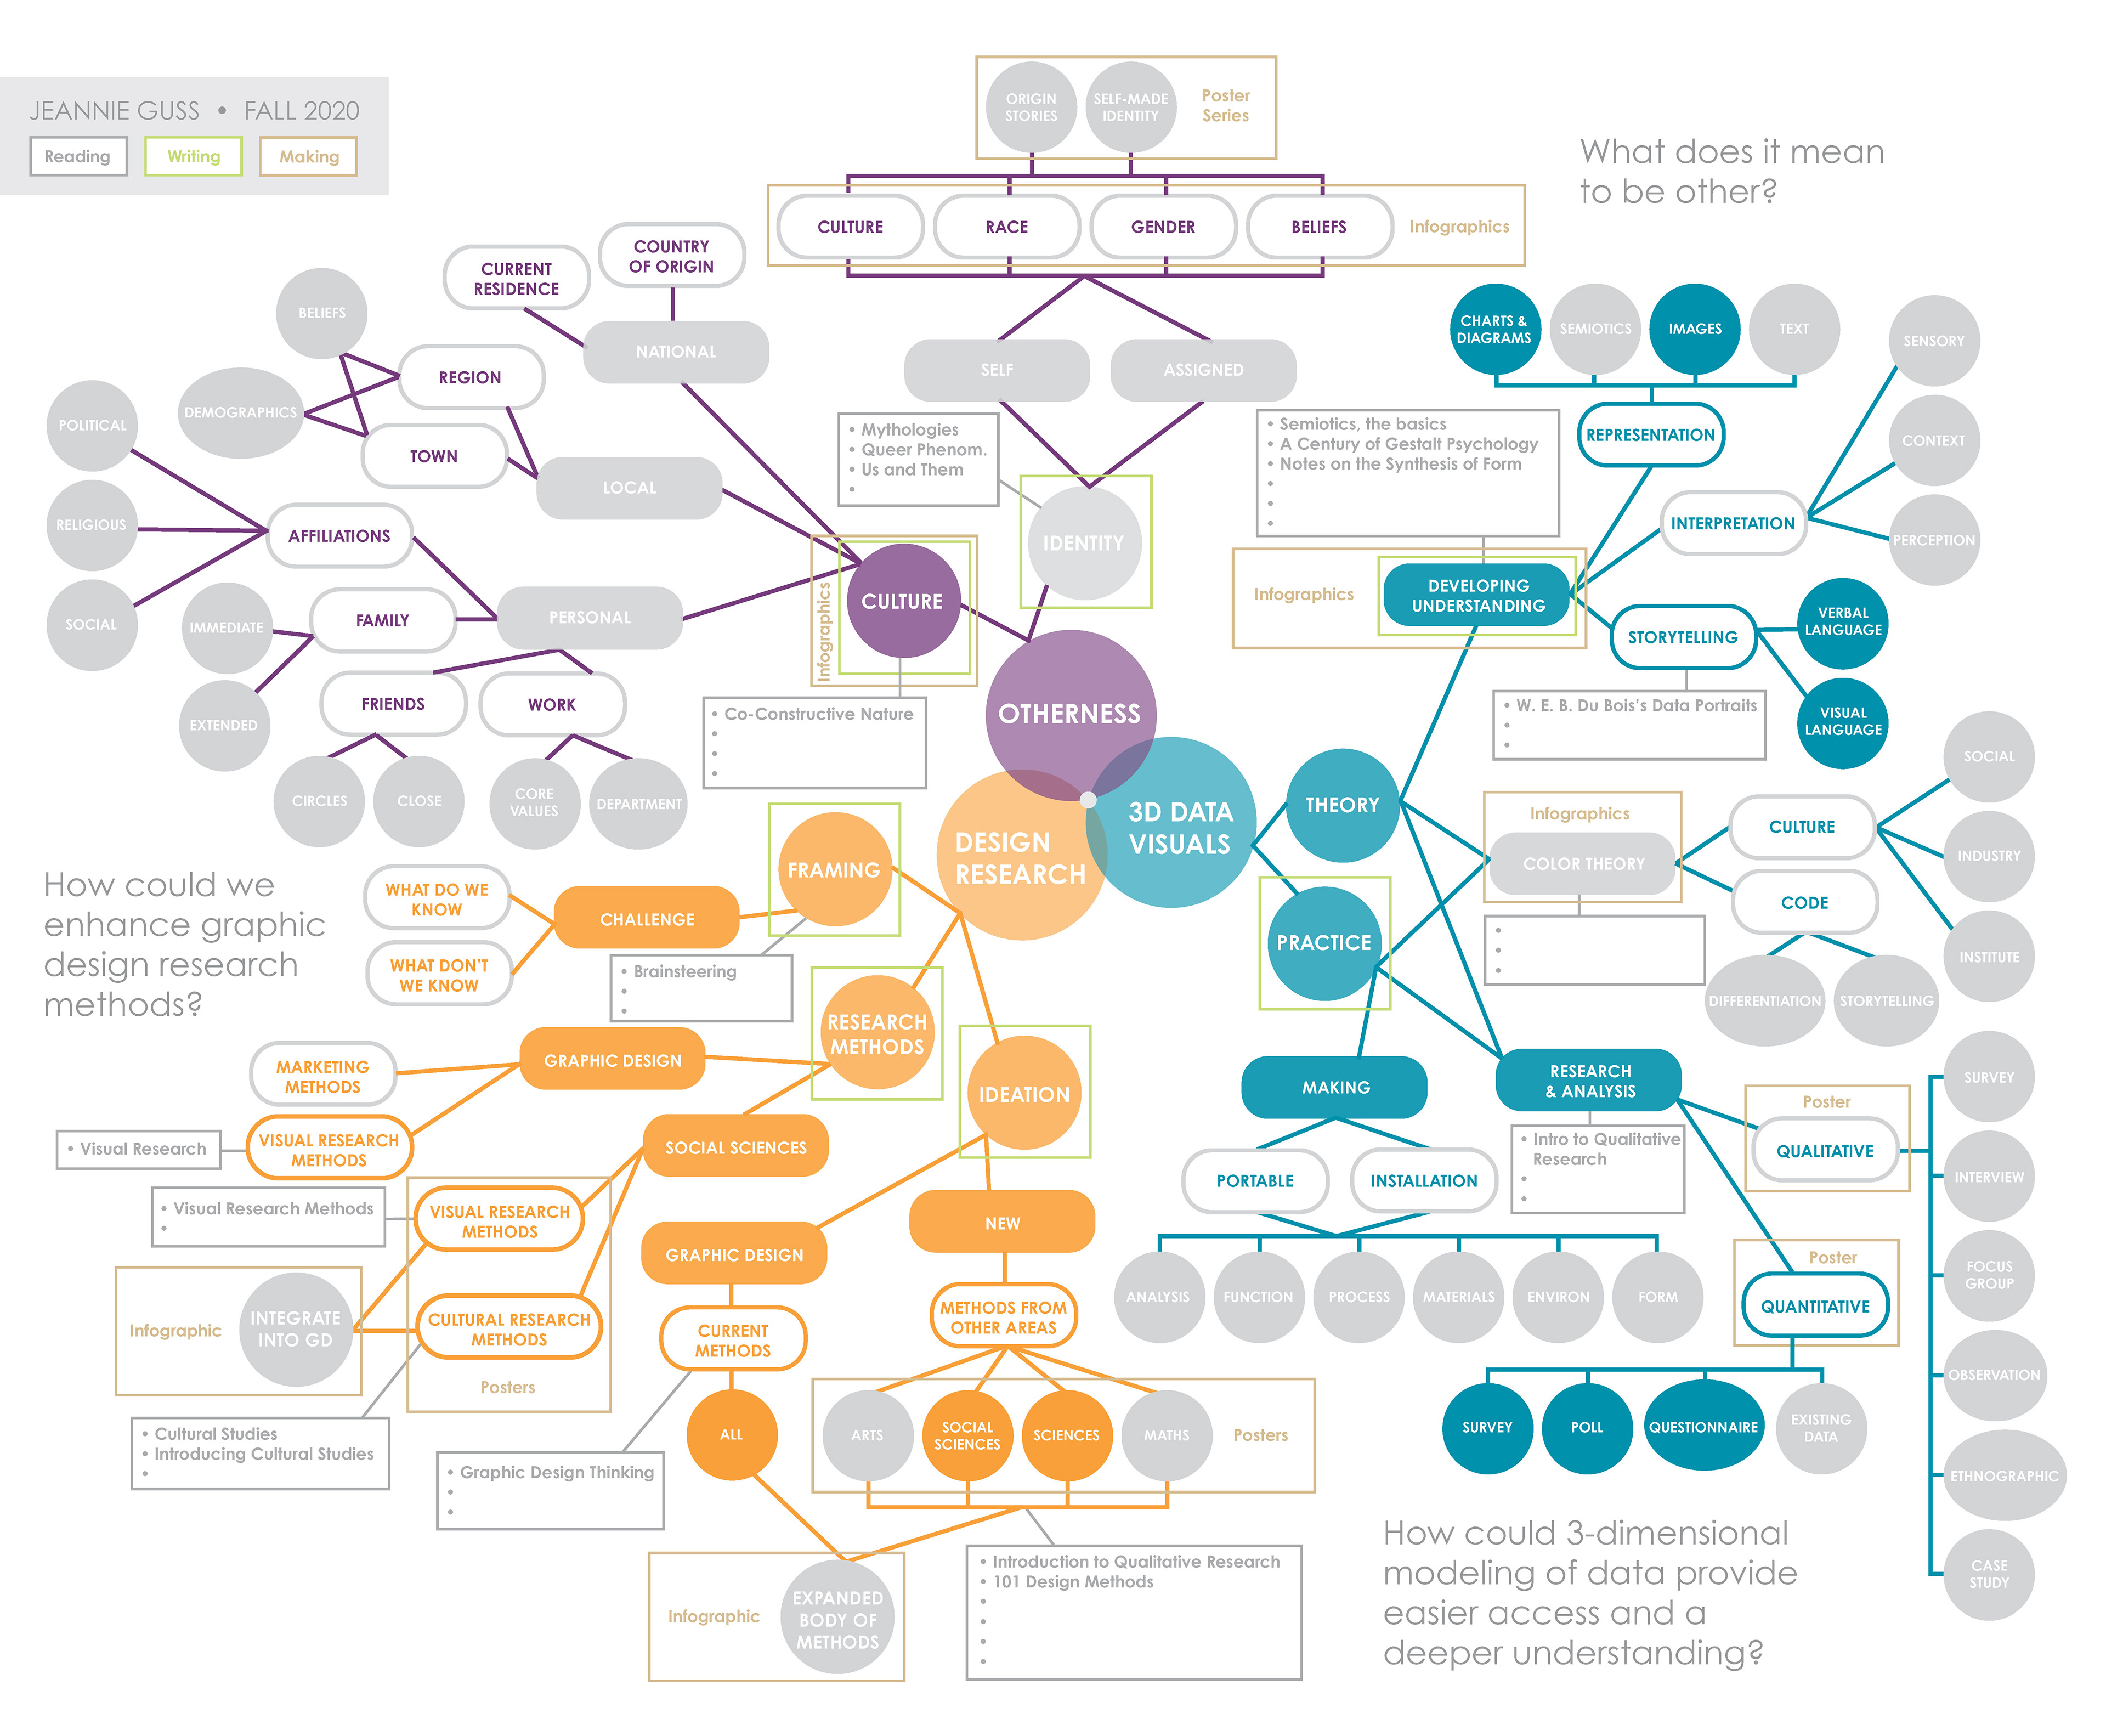
Study plan for one semester and how progress each month was conveyed
visually. The work I did during this semester weighed heavily in my thesis.
visually. The work I did during this semester weighed heavily in my thesis.
After a thorough review of traditional charts and diagrams, I began
experimenting by dimensionalizing traditional charts then progressed
to forms that could provide context and narrative.
experimenting by dimensionalizing traditional charts then progressed
to forms that could provide context and narrative.
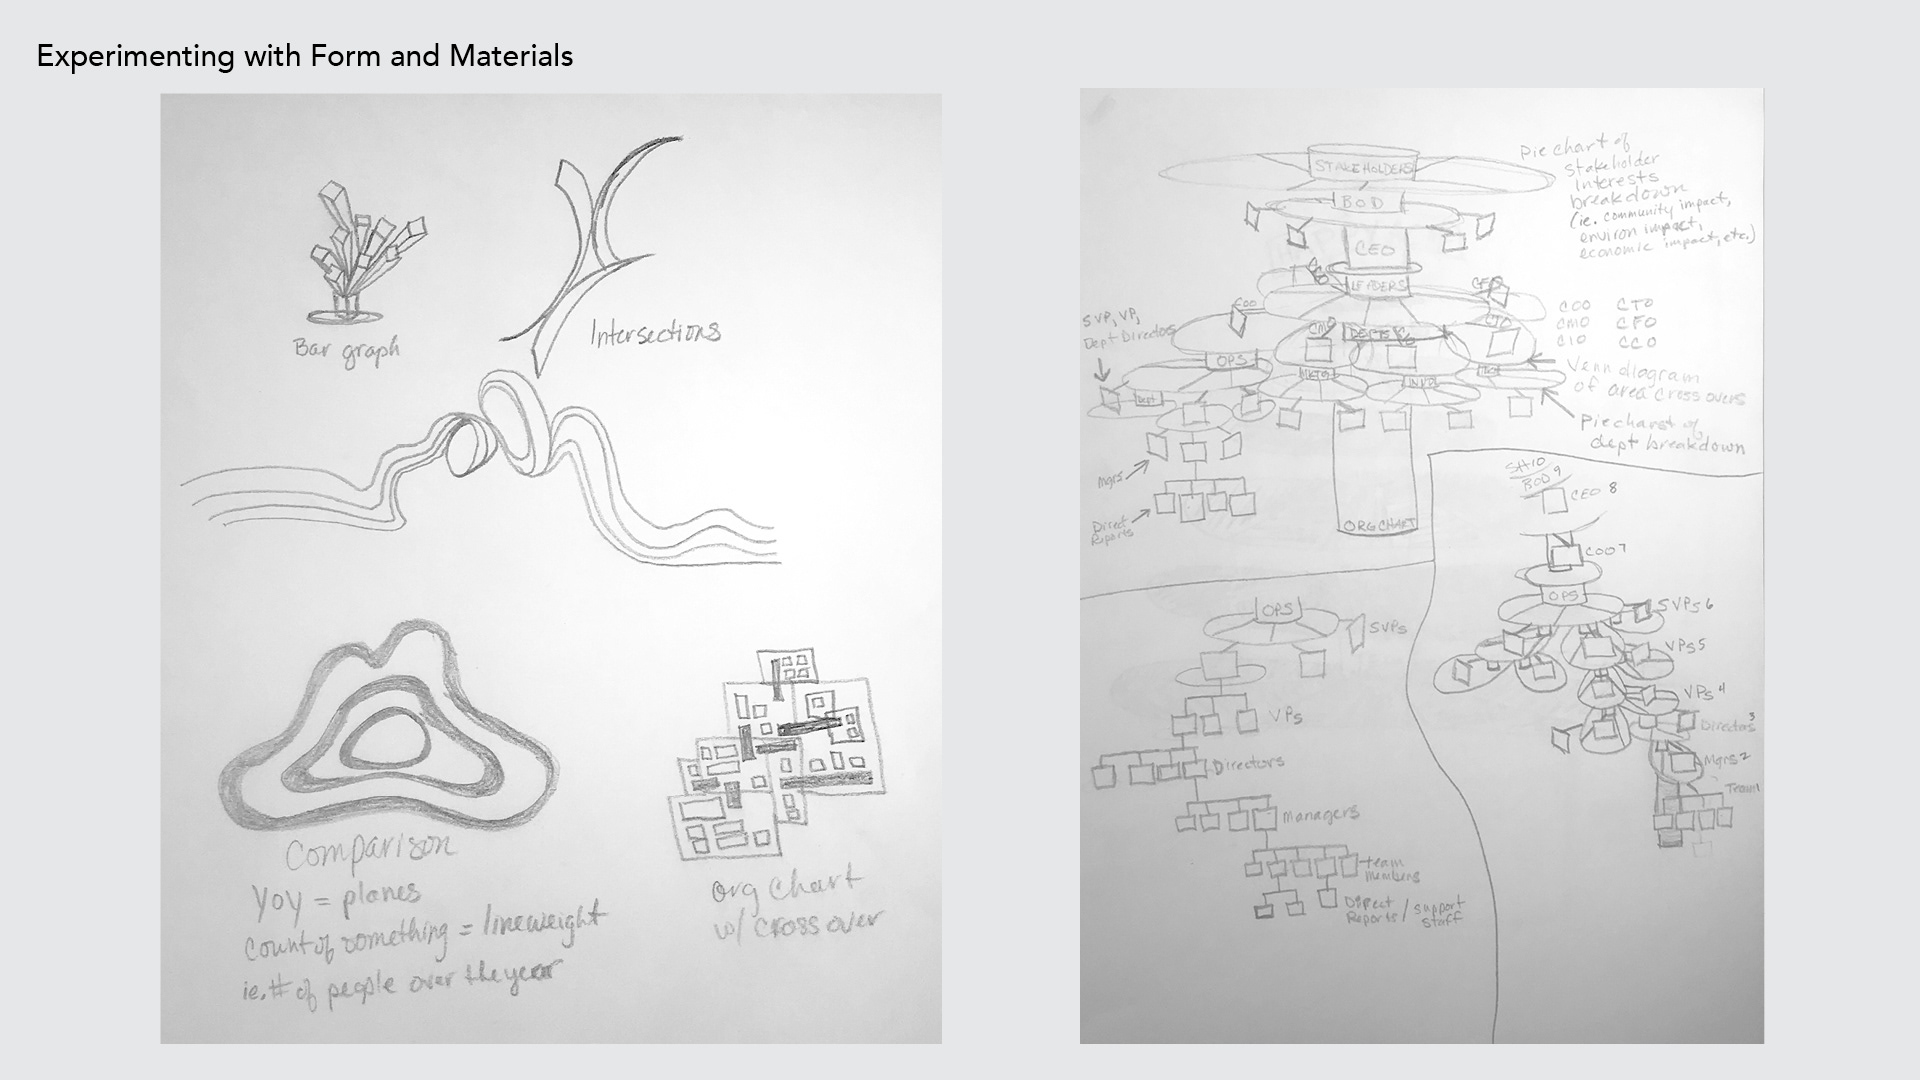
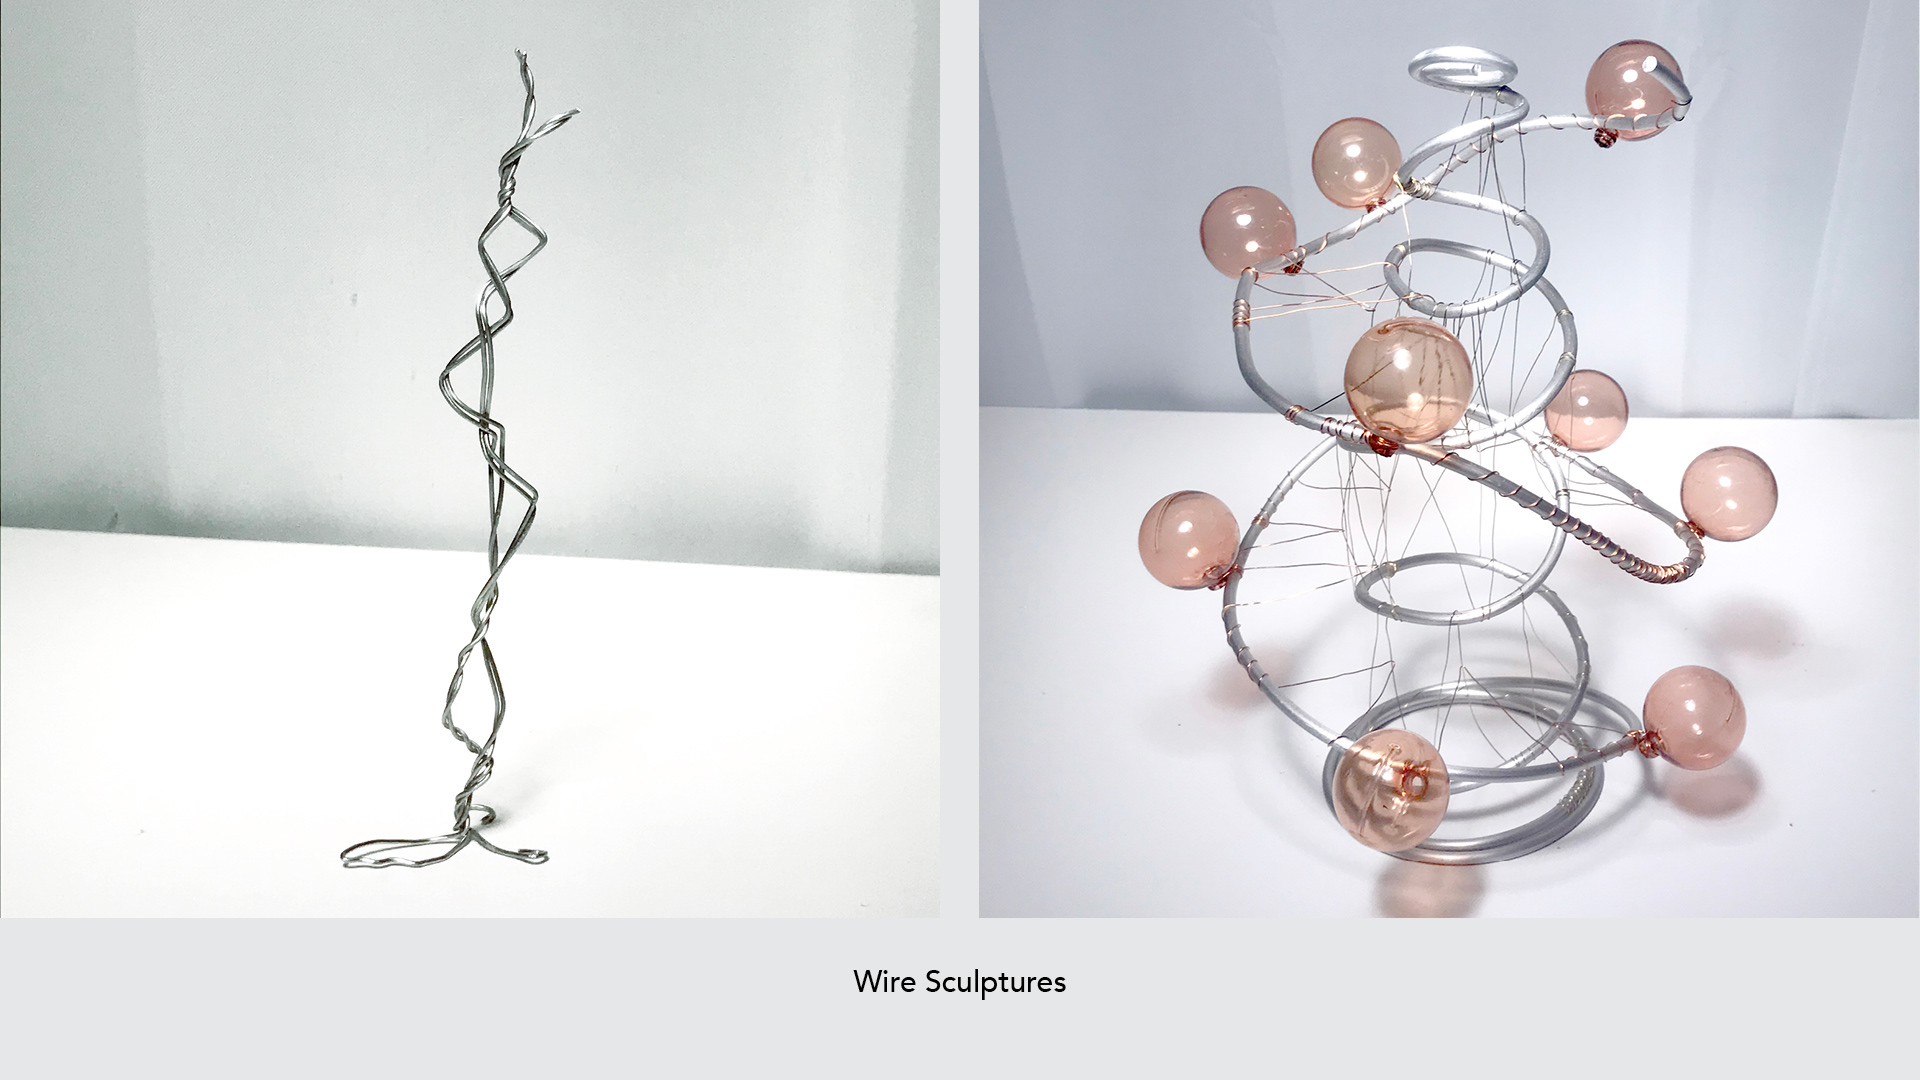
On the left, the wire sculpture began as a line graph.
On the right, the model began as a line-plot chart.
On the right, the model began as a line-plot chart.
On the left, the line chart became a paper sculpture where the negative
space and the shadow became part of the story of the visualization.
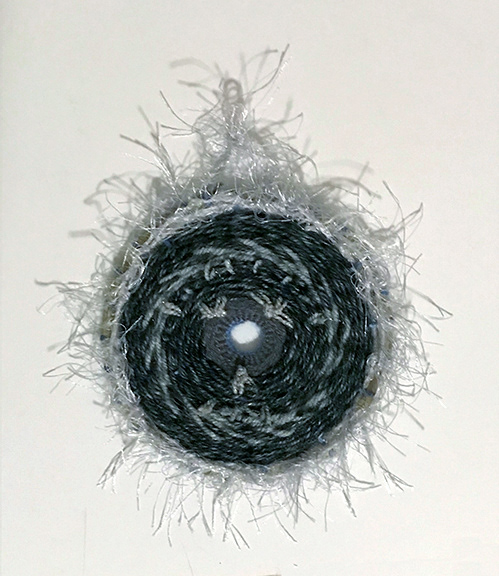
On the right, using yarns with different colors and texture to create a woven
diagram allowed artistic agency to occur in the making process.
space and the shadow became part of the story of the visualization.
On the right, using yarns with different colors and texture to create a woven
diagram allowed artistic agency to occur in the making process.

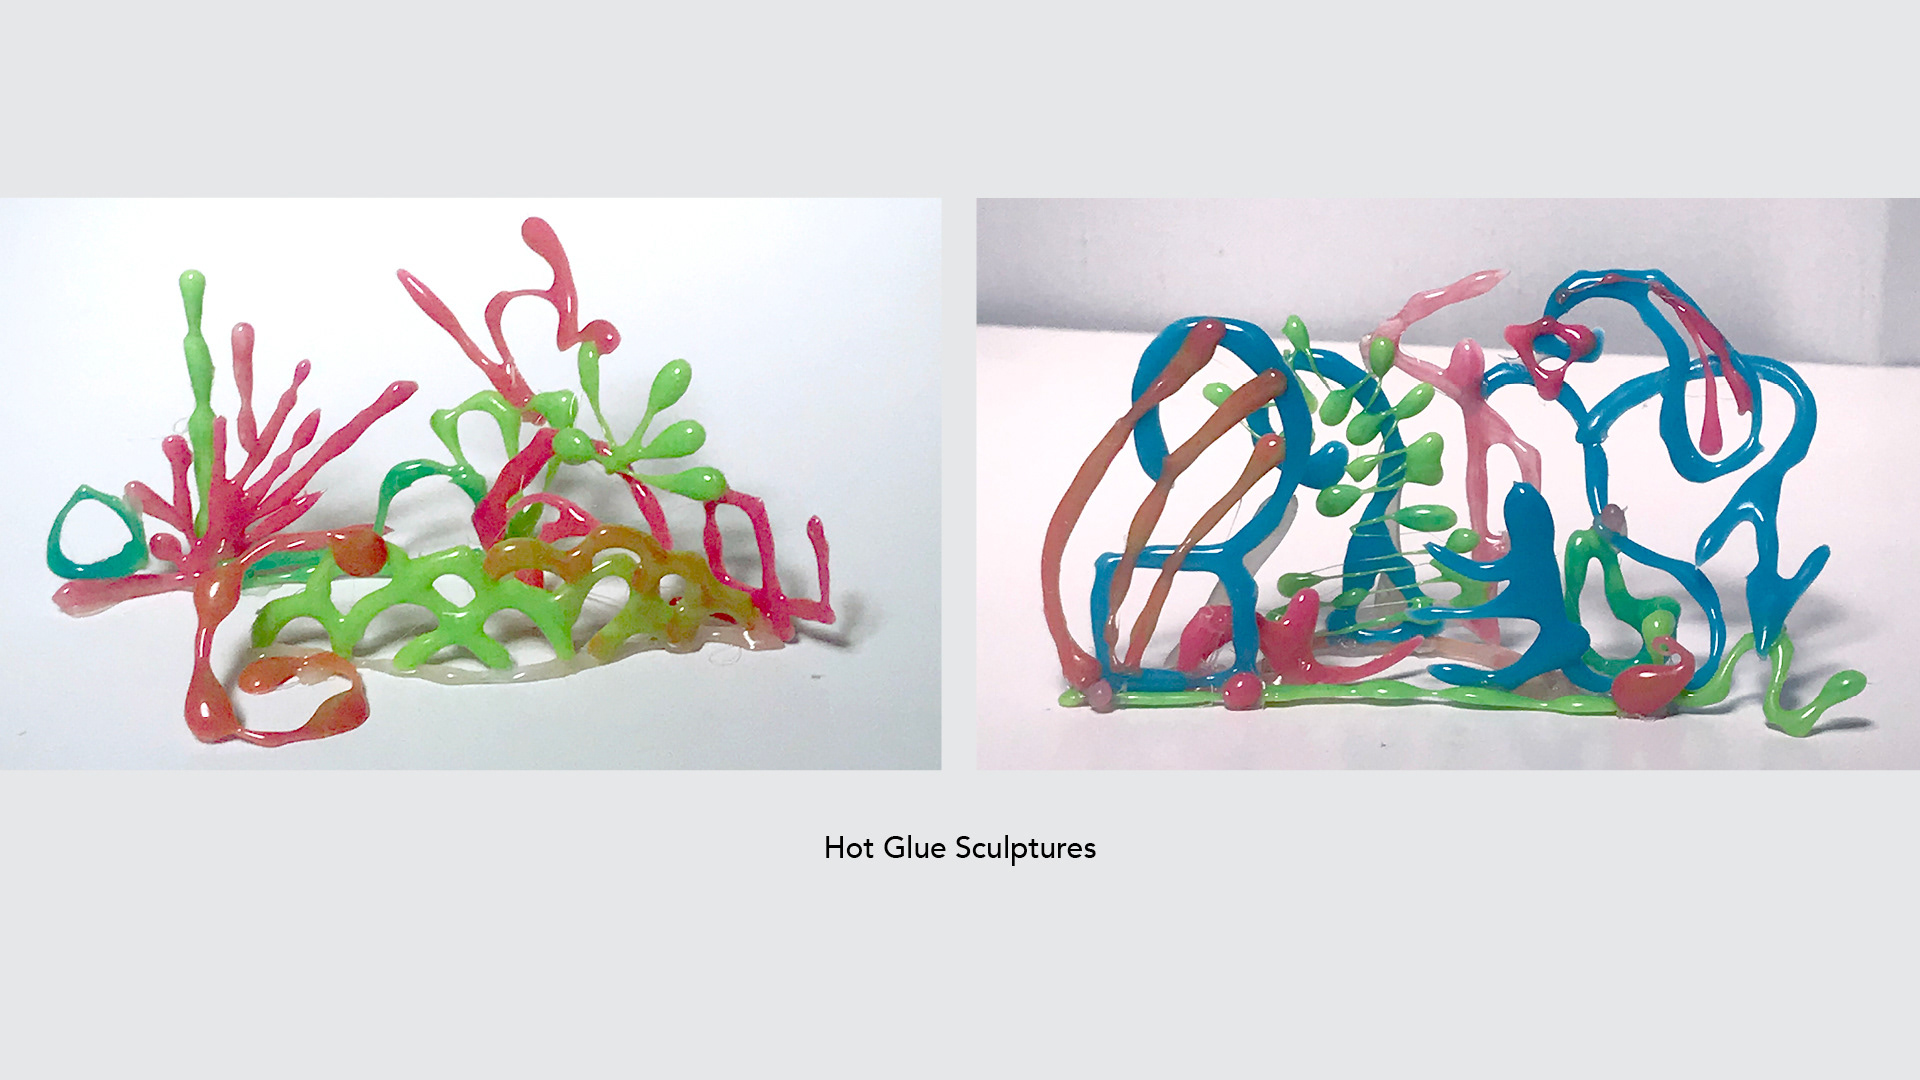
Using colored hot glue, these experiments began to layer several visualizations to define the
data in a more complex and interesting visual manner. By combining data visualizations I
hoped the visual nature of the sculpture would add to the context of the subject and findings.
data in a more complex and interesting visual manner. By combining data visualizations I
hoped the visual nature of the sculpture would add to the context of the subject and findings.
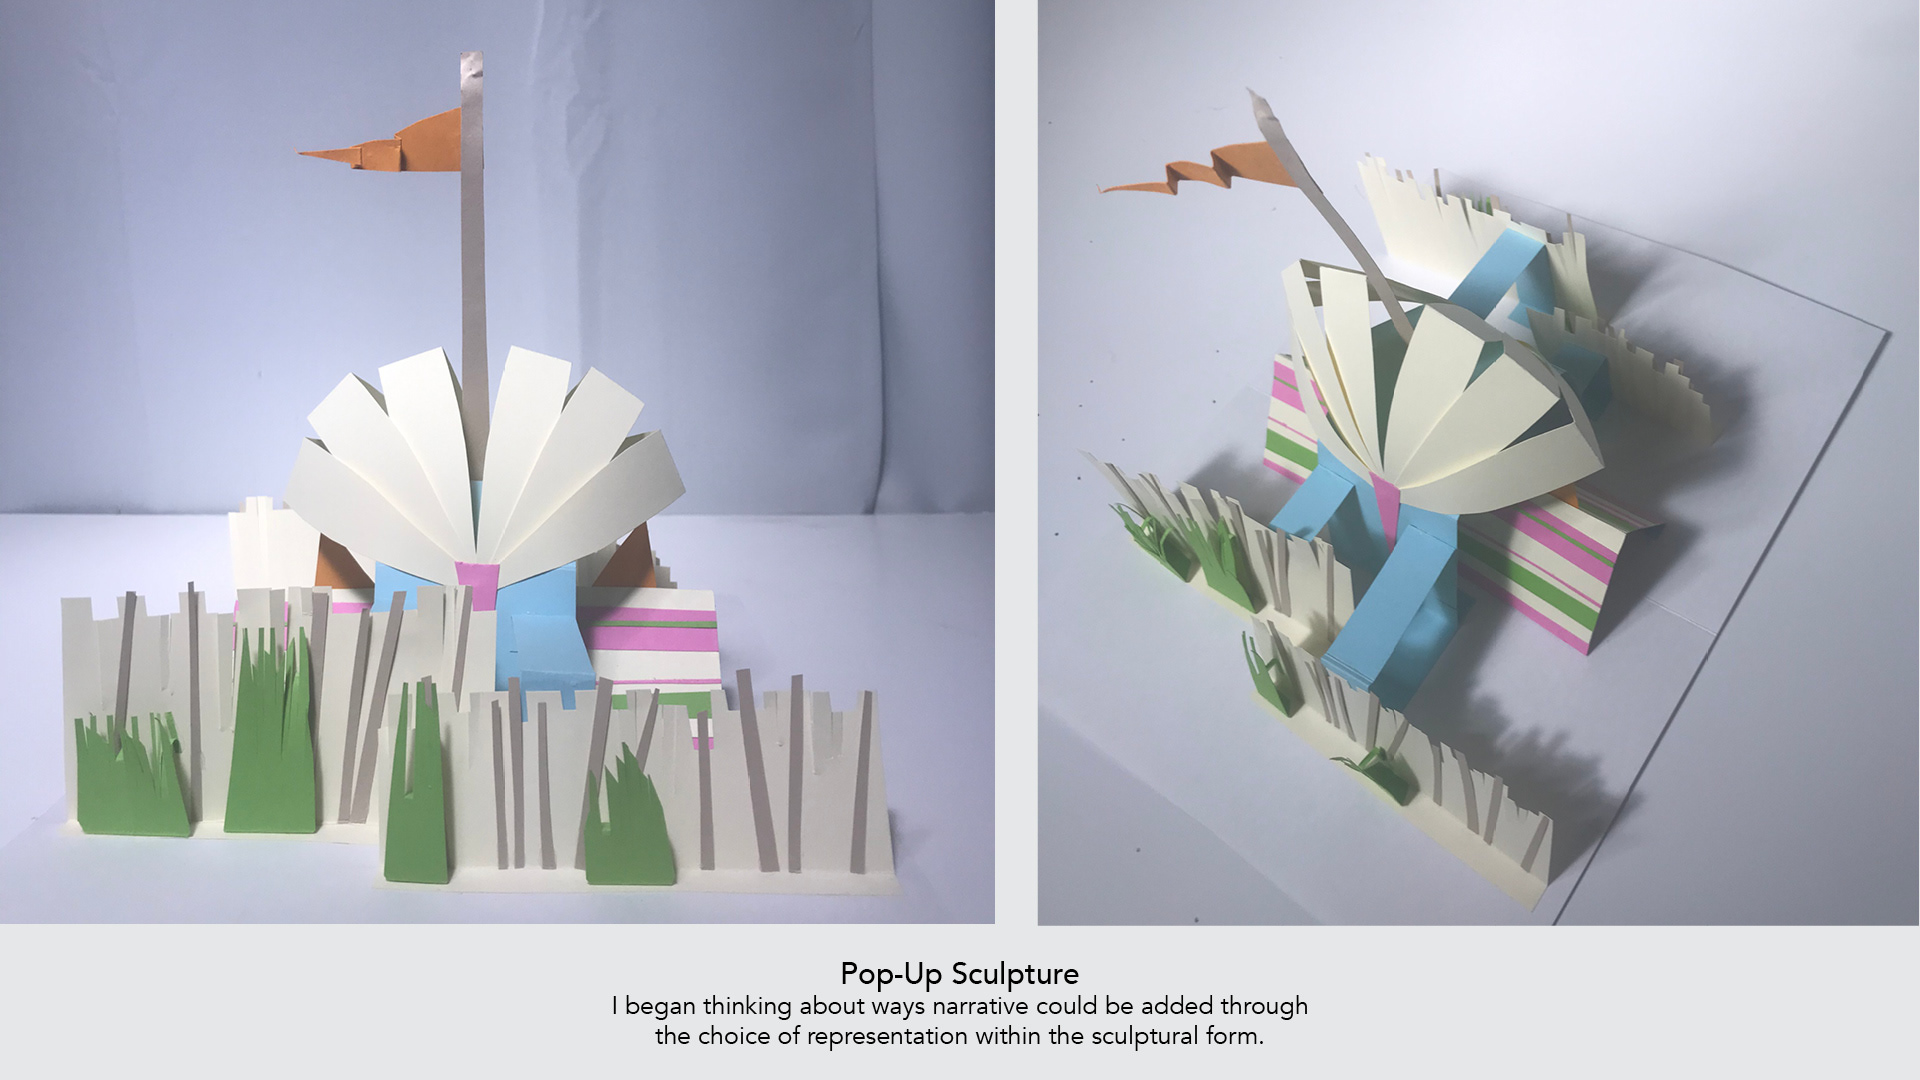
Combining the art of the pop-up book with data visualization was natural
and has great potential in the storytelling of the data findings.
and has great potential in the storytelling of the data findings.